|
|
|
 |
|
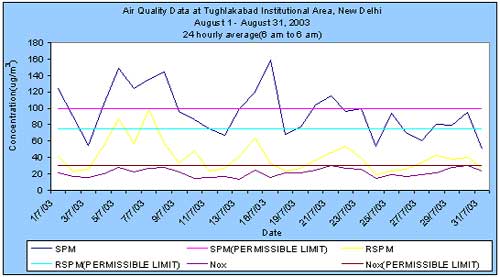
Air
Quality for the month of August, 2003 |
Parameters
Date |
Suspended
Particulate Matter (mg/m3) |
Respirable
Suspended Particulate
Matter (mg/m3) |
Sulphur
dioxide
(m/m3) |
Nitrogen
dioxide
(mg/m3) |
Maximum *
Permissible limit (mg/m3) |
100 |
75 |
30 |
30 |
01/8/03 |
123.97 |
41.86 |
2.77 |
21.10 |
02/8/03 |
90.67 |
23.53 |
2.83 |
16.96 |
03/8/03 |
54.92 |
25.06 |
2.54 |
15.77 |
04/8/03 |
104.94 |
54.89 |
3.05 |
20.27 |
05/8/03 |
149 |
86.87 |
3.02 |
27.61 |
06/8/03 |
124.52 |
57.15 |
3.02 |
22.07 |
07/8/03 |
135.52 |
97.80 |
3.03 |
26.63 |
08/8/03 |
144.04 |
57.12 |
3.55 |
27.93 |
09/8/03 |
95.75 |
33.97 |
3 |
22.22 |
10/803 |
85.78 |
48.18 |
2.36 |
14.83 |
11/8/03 |
74.78 |
23.79 |
2.30 |
15.62 |
12/8/03 |
66.56 |
26.89 |
2.93 |
16.17 |
13/8/03 |
99.35 |
40.86 |
2.33 |
13.39 |
14/8/03 |
119.32 |
63.79 |
3.26 |
24.49 |
15/8/03* |
ND |
ND |
ND |
ND |
16/8/03 |
159.12 |
32.81 |
2.65 |
16 |
17/8/03* |
ND |
ND |
ND |
ND |
18/8/03 |
67.72 |
23.14 |
3.97 |
20.72 |
19/8/03 |
77.4 |
26.79 |
3.26 |
21.63 |
20/8/03 |
104.02 |
37.22 |
3.85 |
24.45 |
21/8/03 |
115.17 |
45.72 |
5.04 |
30.53 |
22/8/03 |
95.81 |
53.8 |
3.44 |
26.46 |
23/8/03 |
99.25 |
38.85 |
3.66 |
25.63 |
24/8/03 |
53.68 |
18.88 |
1.87 |
14.71 |
25/8/03 |
94.19 |
23.92 |
2.96 |
19.07 |
26/8/03 |
70.59 |
26.16 |
2.5 |
16.73 |
27/8/03 |
60.06 |
33.36 |
2.57 |
18.59 |
28/8/03 |
79.97 |
42.85 |
3.14 |
21.09 |
29/8/03 |
79.38 |
38.06 |
3.59 |
28.02 |
30/8/03 |
95.41 |
40.28 |
3.69 |
30.30 |
31/8/03 |
50.53 |
26.52 |
2.5 |
22.87 |
*Tughlakabad has been considered as sensitive
area as Batra hospital is in close vicinity.
* Monitoring could not be possible due to Rain/Power failure. |
|
|
*What is AQI?
|
|

