|
|

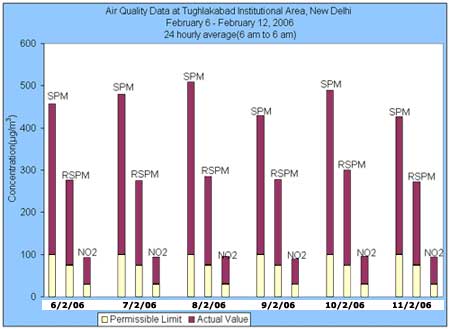
Februray 06 TO February 12,
2006
Parameters Date
(mg/m3) |
Suspended Particulate matter (mg/m3) |
Respirable
Suspended Particulate matter (mg/m3) |
Sulfur dioxide
(mg/m3) |
Nitrogen dioxide
(mg/m3) |
| Maximum*Permissible limit (mg/m3) |
100 |
75 |
30 |
30 |
| 6/2/06 |
357.46 |
201.48 |
3.97 |
62.38 |
| 7/2/06 |
379.84 |
199.28 |
4.40 |
63.55 |
| 8/2/06 |
408.85 |
209.98 |
4.33 |
64.87 |
| 9/2/06 |
328.81 |
202.52 |
4.07 |
60.03 |
| 10/2/06 |
389.28 |
225.65 |
5 |
65.0 |
| 11/2/06 |
326.29 |
197.14 |
5.51 |
63.36 |
| 12/2/06 |
NM |
NM |
NM |
NM |
*Tughlakabad has been considered as sensitive area as Batra hospital is in close vicinity.
NM: Not measured due to unavoidable reasons. |
 |
| |
Actual value |
| |
Permissible limit |
|
*Tughlakabad has been considered
as sensitive area as Batra hospital is in close vicinity.
DATE |
AQI |
DESCRIPTION |
COLOR |
| 6/2/06 |
|
Very
unhealthy |
|
| 7/2/06 |
289.97 |
Very
unhealthy |
|
| 8/2/06 |
301+ |
Very
unhealthy |
|
| 9/2/06 |
264.58 |
Very
unhealthy |
|
| 10/2/06 |
294.66 |
Very
unhealthy |
|
| 11/1/06 |
263.33 |
Very
unhealthy |
|
| 12/1/06
|
NM |
NM |
|
*What is
AQI? |
