|
|

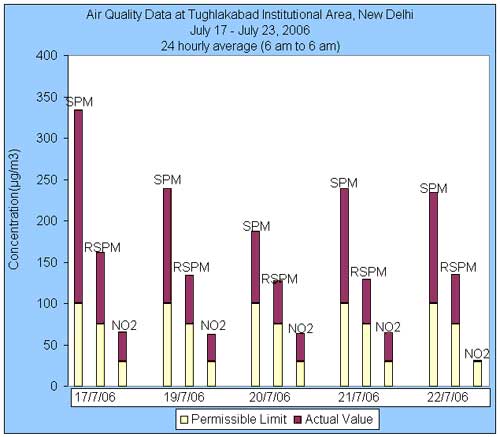
July 17 TO July
23, 2006
|
Parameters
Date
|
Suspended
Particulate matter
(mg/m3) |
Respirable
Suspended Particulate
Matter
(mg/m3) |
Sulfur dioxide
(mg/m3) |
Nitrogen dioxide
(mg/m3) |
|
Maximum*
Permissible limit
(mg/m3) |
100 |
75 |
30 |
30 |
|
17/07/06f |
234.43 |
87.25 |
1.28 |
35.47 |
|
18/07/06 |
NM |
NM |
NM |
NM |
|
19/07/06 |
139.11 |
59.07 |
1.43 |
32.69 |
|
20/07/06f |
87.84 |
52.73 |
1.54 |
33.44 |
|
21/07/06 |
139.46 |
54.85 |
1.90 |
35.11 |
|
22/07/06 |
134.26 |
60.10 |
1.46 |
34.80 |
|
23/07/06 |
NM |
NM |
NM |
NM |
*Tughlakabad has been considered as sensitive area as Batra hospital is
in close vicinity.
f 16
Hourly data
NM: Not measured due to unavoidable reasons. |
 |
| |
Actual value |
| |
Permissible limit |
|
*Tughlakabad has been considered
as sensitive area as Batra hospital is in close vicinity.
|
17/7/06 |
217.63 |
Very Unhealthy |
|
|
18/7/06 |
NM |
NM |
|
|
19/7/06 |
139.11 |
Unhealthy |
|
|
20/7/06 |
87.84 |
Marginal |
|
|
21/7/06 |
139.46 |
Unhealthy |
|
|
22/7/06 |
134.26 |
Unhealthy |
|
|
23/7/06 |
NM |
NM |
|
*What isAQI?
|
