|
|
|
 |
|
|
Air
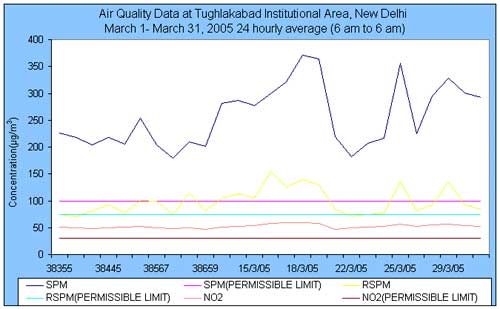
Quality for the Month of March, 2005 |
|
Parameters
Date |
Suspended
Particulate Matter (mg/m3) |
Respirable
Suspended Particulate
Matter (mg/m3) |
Sulphur dioxide
(mg/m3) |
Nitrogen dioxide
(mg/m3) |
Maximum *
Permissible limit (mg/m3) |
100 |
75 |
30 |
30 |
01/3/05 |
226.86 |
74.48 |
4.65 |
50.84 |
02/3/05 |
217.37 |
70.82 |
4.74 |
49.52 |
03/3/05 |
204.46 |
80.99 |
4.42 |
48.33 |
04/3/05 |
217.52 |
92.62 |
4.71 |
49.94 |
05/3/05 |
205.32 |
77.74 |
4.45 |
50.99 |
06/3/05 |
NM |
NM |
NM |
NM |
07/3/05 |
253.91 |
101.18 |
4.77 |
52.40 |
08/3/05 |
204.42 |
99.71 |
4.50 |
50.22 |
09/3/05 |
179.32 |
74.79 |
4.07 |
47.89 |
10/3/05 |
210.08 |
113.89 |
4.25 |
50.06 |
11/3/05 |
201.16 |
81.71 |
4.94 |
47.04 |
12/3/05 |
281.58 |
105.47 |
5.07 |
51.03 |
13/3/05 |
NM |
NM |
NM |
NM |
14/3/05 |
287.12 |
113.19 |
5.14 |
51.78 |
15/3/05 |
277.85 |
105.50 |
5.69 |
54.13 |
16/3/05 |
299.67 |
154.29 |
6.08 |
57.46 |
17/3/05 |
320.96 |
126 |
6.20 |
58.68 |
18/3/05 |
370.41 |
138.92 |
6.33 |
58.87 |
19/3/05 |
364.36 |
129.90 |
6.31 |
58.12 |
20/3/05 |
NM |
NM |
NM |
NM |
21/3/05 |
218.75 |
83.61 |
4.92 |
47.46 |
22/3/05 |
181.90 |
71.60 |
4.61 |
49.72 |
23/3/05 |
207.20 |
74.52 |
5.86 |
50.71 |
24/3/05 |
216.64 |
77.20 |
5.13 |
51.93 |
25/3/05 |
355.22 |
135.77 |
6.21 |
56.98 |
26/3/05 |
224.39 |
80.82 |
5.29 |
52.83 |
27/3/05 |
NM |
NM |
NM |
NM |
28/3/05 |
295.50 |
92.42 |
5.69 |
55.62 |
29/3/05 |
328.90 |
134.94 |
6.39 |
57.11 |
30/3/05 |
301.19 |
92.97 |
6.41 |
53.17 |
31/3/05 |
292.86 |
84.50 |
5.84 |
51.87 |
*Tughlakabad has been considered as sensitive area as Batra hospital is in close
vicinity.
NM – Not measured due to unavoidable reasons.
*What is
AQI? |
|

