|
|
|
 |
|
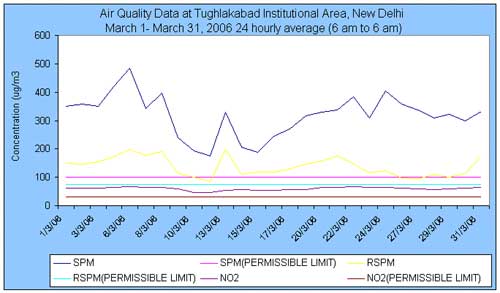
Air Quality for the Month of Marach, 2006 |
|
Parameters Date |
Suspended Particulate Matter 12.0pt (mg/m3) |
Respirable
Suspended Particulate
Matter (mg/m3) |
Sulphur dioxide
(mg/m3)
|
Nitrogen dioxide
(mg/m3)
|
Maximum * Permissible limit (mg/m3) |
100 |
75 |
30 |
30 |
01/3/06 |
351.11 |
149.16 |
4.09 |
62.48 |
02/3/06 |
357.18 |
147.46 |
4.56 |
62.24 |
03/3/06 |
350.54 |
155.10 |
4.88 |
61.37 |
04/3/06 |
420.77 |
171.46 |
5.81 |
65.66 |
05/3/06 |
NM |
NM |
NM |
NM |
06/3/06 |
482.92 |
199.48 |
4.90 |
66.46 |
07/3/06# |
343.07 |
178.59 |
5.69 |
65.48 |
08/3/06 |
396.01 |
191.69 |
4.57 |
63.35 |
09/3/06 |
240.29 |
112.23 |
3.56 |
59.61 |
10/3/06 |
194.09 |
100.47 |
2.94 |
45.96 |
11/3/06# |
174.3 |
83.83 |
4.75 |
47.59 |
12/3/06 |
NM |
NM |
NM |
NM |
13/3/06 |
329.59 |
197.02 |
3.63 |
53.74 |
14/3/06 |
206.27 |
111.87 |
3.64 |
55.76 |
15/3/06 |
187.61 |
118.26 |
2.96 |
55.03 |
16/3/06 |
244.86 |
118.25 |
3.25 |
53.25 |
17/3/06 |
270.15 |
129.58 |
3.98 |
57.16 |
18/3/06 |
315.60 |
147.13 |
3.07 |
57.31 |
19/3/06 |
NM |
NM |
NM |
NM |
20/3/06 |
330.08 |
155.92 |
4.21 |
63.44 |
21/3/06 |
338.45 |
176.35 |
3.97 |
64.40 |
22/3/06 |
384.33 |
146.86 |
5.32 |
65.72 |
23/3/06 |
308.74 |
116.45 |
4.66 |
63.95 |
24/3/06 |
404.42 |
123.85 |
4.18 |
64.19 |
25/3/05 |
357.26 |
98.16 |
4.11 |
61.73 |
26/3/06 |
NM |
NM |
NM |
NM |
27/3/06 |
338.49 |
95.09 |
3.68 |
58.09 |
28/3/06 |
309.26 |
108.44 |
3.83 |
56.52 |
29/3/06 |
320.63 |
99.20 |
3.80 |
59.93 |
30/3/06 |
299.77 |
114.30 |
4.76 |
61.69 |
31/3/06 |
333.29 |
174.28 |
4.99 |
64.69 |
|
*What is
AQI? |
|

