Air
Pollution Monitoring at Tughlakabad Institutional Area, New Delhi
Ambient air data of four criteria pollutants obtained during November 2002 to November
2003 is presented in Table 1 and Graphs respectively.
 SUSPENDED
PARTICULATE MATTER (SPM) SUSPENDED
PARTICULATE MATTER (SPM)
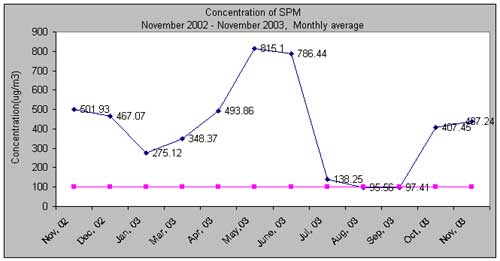
SPM levels have remained 2.75 to 8.15 times the permissible limit 100µg/m3 for
sensitive areas throughout the year except during the rainy month of July to September.
During November 2002(festival month) it was 501.93 µg/m3 that is 5.01 times
the permissible limit. It reduced marginally during December and January due to excessive
fog and winter showers but even then it was 4.6 times and 2.7 times higher than
permissible limit.
With the advent of summer SPM levels
start increasing due to dust from Rajasthan desert area. The maximum annual SPM level was
recorded in May 2003 about 815.10 µg/m3 around 8.15 times the permissible
limit.
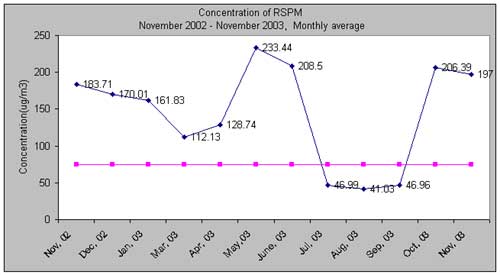
RESPIRABLE SUSPENDED PARTICULATE MATTER (RSPM)
RSPM levels have remained 1.49 to 3.11 times the prescribed standard of 75 µg/m3
for sensitive area except during the rainy month of July to September. During November
2002 (festival month) it was 183.71 µg/m3, which is 2.4 times the permissible
limit. In the subsequent months it showed marginally decreasing trend due to excessive fog
and winter showers but even then it was 2.26 times and 2.15 times higher than permissible
limit. It showed increasing trend from April due to dust from Rajasthan desert area with a
peak value of 233.44 µg/m3 in the month of May 2003 that is 3.11 times the
permissible limit.
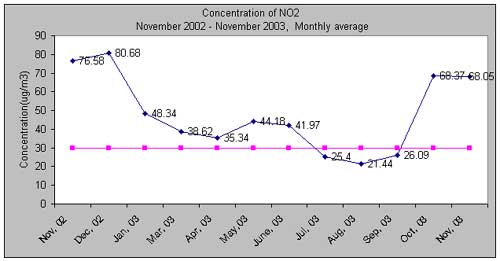
NITROGEN DIOXIDE (NO2)
Nitrogen dioxide varied from 1.17 to 2.68 times the permissible limits of 30 µg/m3
for sensitive areas except during rainy months of July, August and September 2003. It
remained maximum in December 2002 about 80.68 µg/m3, which is 2.68 times the
permissible limit. The reasons discussed for decline and increasing trend in RSPM as well
NO2 are almost the same except the fact that RSPM values may also be attributed
to natural sources.
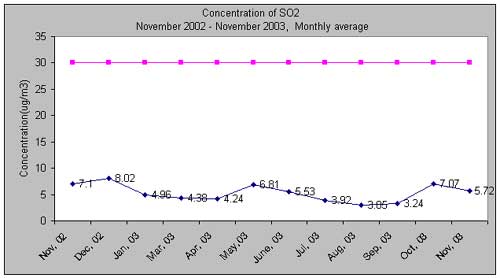
SULPHUR DIOXIDE (SO2)
Sulphur dioxide has all along been low mostly in the range of 3 – 8 µg/m3
(permissible limit 30 µg/m3). Its highest value was 8.02 µg/m3 in
December 2002 and lowest was in August 2003 around 3.05 µg/m3.
The results obtained from November 2002
to November 2003 indicate that Tughlakabad Institutional Area in a sensitive zone has
serious Air pollution problem with regard to SPM, RSPM and NO2, which were
beyond the permissible limits during the entire year except during the monsoon months. The
concentrations of sulphur dioxide were relatively low and within the limits.
TABLE: 1 MONTHLY AVERAGE OF SPM, RSPM,
SO2 AND NO2 AT TUGHLAKABAD INSTITUTIONAL AREA, NEW DELHI
NOVEMBER 2002 – NOVEMBER 2003 MONTHLY AVERAGES
Parameters
Months |
Suspended
Particulate Matter (µg/m3) |
Respirable
Suspended Particulate
Matter (µg/m3) |
Sulphur
dioxide
(µg/m3) |
Nitrogen
dioxide
(µg/m3) |
Maximum *
Permissible limit (µg/m3) |
100 |
75 |
30 |
30 |
November
2002 |
501.93 |
183.71 |
7.10 |
76.58 |
December
2002 |
467.07 |
170.01 |
8.02 |
80.68 |
January
2003 |
275.12 |
161.83 |
4.96 |
48.34 |
February
2003 |
NM |
NM |
NM |
NM |
March
2003 |
348.37 |
112.13 |
4.38 |
38.62 |
April
2003 |
493.86 |
128.74 |
4.24 |
35.34 |
May 2003 |
815.10 |
233.44 |
6.81 |
44.18 |
June 2003 |
786.44 |
208.50 |
5.53 |
41.97 |
July 2003 |
138.25 |
46.99 |
3.92 |
25.40 |
August
2003 |
95.56 |
41.03 |
3.05 |
21.44 |
September
2003 |
97.41 |
46.96 |
3.24 |
26.09 |
October
2003 |
407.45 |
206.39 |
7.07 |
68.37 |
November
2003 |
437.24 |
197.00 |
5.72 |
68.05 |
*Tughlakabad has been considered as sensitive
area as Batra hospital is in close vicinity.
NM – Not measured due to unavoidable reasons.
|