|
|
|
 |
|
| Date |
AQI |
Description |
Color |
| 24/04/03 |
301+ |
Critical |
|
|
|
 |
| |
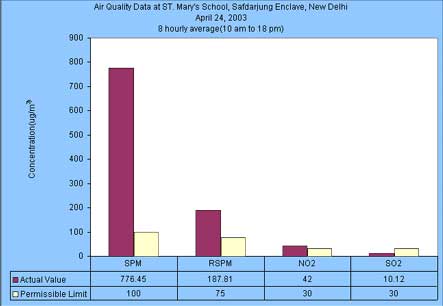
Actual value |
| |
Permissible limit |
|
NOTE: *ST. Mary’s School
falls under the category of Sensitive Areas as Schools comes in silence zone.
AQI
INDEX |
| INDEX VALUE |
DESCRIPTION |
COLOUR |
| 0-50 |
Good |
Green |
| 51-100 |
Marginal (Moderate) |
Yellow |
| 101-200 |
Unhealthy (Poor) |
Orange |
| 201-300 |
Very unhealthy (Very Poor) |
Red |
| 301+ |
Critical |
Purple |
|
|
*What is AQI?
|
|
|