|
|

April 11 TO April 17, 2005
Parameters
Date |
Suspended
Particulate matter (mg/m3) |
Respirable
Suspended Particulate
Matter (mg/m3) |
Sulfur
dioxide
(mg/m3) |
Nitrogen
dioxide
(mg/m3) |
Maximum*
Permissible limit (mg/m3) |
100 |
75 |
30 |
30 |
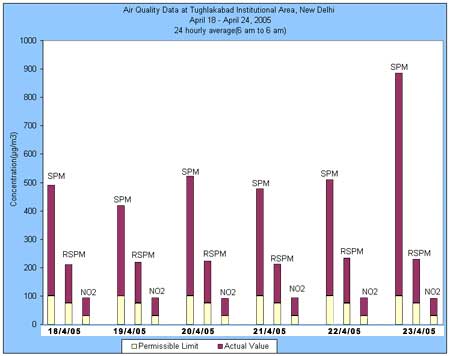
18/4/05 |
390.50 |
134.19 |
5.94 |
63.22 |
19/4/05 |
318.85 |
143.99 |
5.64 |
62.50 |
20/4/05 |
422.27 |
147.18 |
5.90 |
62.09 |
21/4/05 |
376.94 |
136.66 |
5.95 |
62.56 |
22/4/05 |
409.50 |
159.53 |
6.35 |
63.09 |
23/4/05 |
785.01 |
153.27 |
6.17 |
61.04 |
24/4/05 |
NM |
NM |
NM |
NM |
*Tughlakabad has been considered as sensitive area as Batra hospital is in close vicinity.
NM: Not measured due to unavoidable reasons. |
 |
| |
Actual value |
| |
Permissible limit |
|
*Tughlakabad has been considered
as sensitive area as Batra hospital is in close vicinity.
DATE |
AQI |
DESCRIPTION |
COLOR |
| 18/4/05 |
295.27 |
Very
Unhealthy |
|
| 19/4/05 |
259.62 |
Very
Unhealthy |
|
| 20/4/05 |
301+ |
Critical |
|
| 21/4/05 |
288.52 |
Very
Unhealthy |
|
| 22/4/05 |
301+ |
Critical |
|
| 23/4/05 |
301+ |
Critical |
|
| 24/4/05 |
NM |
|
|
AQI
INDEX |
| INDEX VALUE |
DESCRIPTION |
COLOUR |
| 0-50 |
Good |
Green |
| 51-100 |
Marginal (Moderate) |
Yellow |
| 101-200 |
Unhealthy (Poor) |
Orange |
| 201-300 |
Very Unhealthy (Very Poor) |
Red |
| 301+ |
Critical |
Purple |
*What is
AQI? |
