|
|

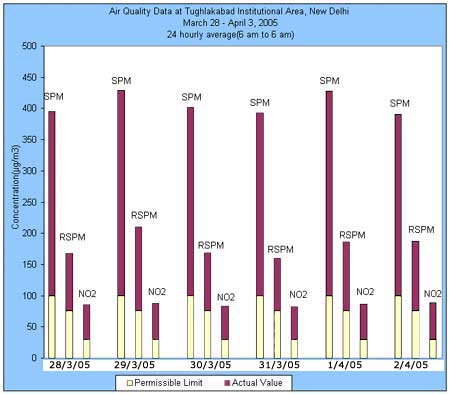
March 28 TO April 03, 2005
Parameters
Date |
Suspended
Particulate matter (mg/m3) |
Respirable
Suspended Particulate
Matter (mg/m3) |
Sulfur
dioxide
(mg/m3) |
Nitrogen
dioxide
(mg/m3) |
Maximum*
Permissible limit (mg/m3) |
100 |
75 |
30 |
30 |
28/3/05 |
295.50 |
92.42 |
5.69 |
55.62 |
29/3/05 |
328.90 |
134.94 |
6.39 |
57.11 |
30/3/05 |
301.19 |
92.97 |
6.41 |
53.17 |
31/3/05 |
292.86 |
84.50 |
5.84 |
51.87 |
1/4/05 |
328.13 |
111.35 |
5.92 |
56.64 |
2/4/05 |
290.64 |
111.72 |
6.21 |
58.18 |
3/4/05 |
NM |
NM |
NM |
NM |
*Tughlakabad has been
considered as sensitive area as Batra hospital is in close vicinity.
NM: Not measured due to unavoidable reasons. |
 |
| |
Actual value |
| |
Permissible limit |
|
*Tughlakabad has been considered
as sensitive area as Batra hospital is in close vicinity.
DATE |
AQI |
DESCRIPTION |
COLOR |
| 28/3/05 |
248.01 |
Very
Unhealthy |
|
| 29/3/05 |
264.62 |
Very
Unhealthy |
|
| 30/3/05 |
250.84 |
Very
Unhealthy |
|
| 31/3/05 |
246.69 |
Very
Unhealthy |
|
| 1/4/05 |
264.24 |
Very
Unhealthy |
|
| 2/4/05 |
245.59 |
Very
Unhealthy |
|
| 3/4/05 |
NM |
|
|
AQI
INDEX |
| INDEX VALUE |
DESCRIPTION |
COLOUR |
| 0-50 |
Good |
Green |
| 51-100 |
Marginal (Moderate) |
Yellow |
| 101-200 |
Unhealthy (Poor) |
Orange |
| 201-300 |
Very Unhealthy (Very Poor) |
Red |
| 301+ |
Critical |
Purple |
*What is
AQI? |
