|
|

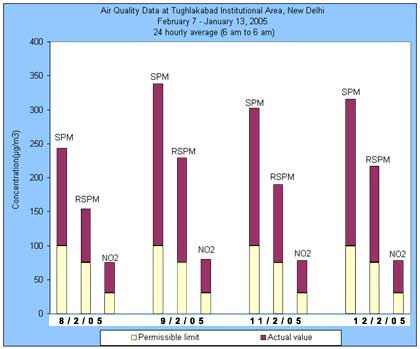
February 07 TO February 13,
2005
Parameters
Date |
Suspended
Particulate matter (mg/m3) |
Respirable
Suspended Particulate
Matter (mg/m3) |
Sulfur
dioxide
(mg/m3) |
Nitrogen
dioxide
(mg/m3) |
Maximum*
Permissible limit (mg/m3) |
100 |
75 |
30 |
30 |
7/2/05 |
NM |
NM |
NM |
NM |
8/2/05 |
143.48 |
79.03 |
4.26 |
44.98 |
9/2/05 |
238.14 |
153.98 |
4.57 |
49.79 |
10/2/05 |
NM |
NM |
NM |
NM |
11/2/05 |
202.28 |
114.37 |
4.68 |
48.03 |
12/2/05 |
215.62 |
142.35 |
4.29 |
47.64 |
13/2/05 |
NM |
NM |
NM |
NM |
*Tughlakabad has been
considered as sensitive area as Batra hospital is in close vicinity.
NM: Not measured due to unavoidable reasons. |
|
| |
Actual value |
| |
Permissible limit |
|
*Tughlakabad has been considered
as sensitive area as Batra hospital is in close vicinity.
DATE |
AQI |
DESCRIPTION |
COLOR |
| 7/2/05 |
NM |
|
|
| 8/2/05 |
143.48 |
Very
Unhealthy |
|
| 9/2/05 |
219.47 |
Very
Unhealthy |
|
| 10/2/05 |
NM |
|
|
| 11/2/05 |
201.63 |
Very
Unhealthy |
|
| 12/2/05 |
208.27 |
Very
Unhealthy |
|
| 13/2/05 |
NM |
|
|
AQI
INDEX |
| INDEX VALUE |
DESCRIPTION |
COLOUR |
| 0-50 |
Good |
Green |
| 51-100 |
Marginal (Moderate) |
Yellow |
| 101-200 |
Unhealthy (Poor) |
Orange |
| 201-300 |
Very Unhealthy (Very Poor) |
Red |
| 301+ |
Critical |
Purple |
*What is
AQI? |

