|
|

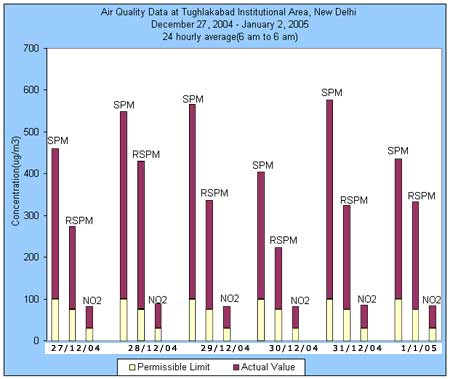
December 27, 2004 TO
January 02, 2005
Parameters
Date |
Suspended
Particulate matter
(mg/m3) |
Respirable
Suspended Particulate
Matter (mg/m3) |
Sulfur
dioxide
(mg/m3) |
Nitrogen
dioxide
(mg/m3) |
Maximum*
Permissible limit (mg/m3) |
100 |
75 |
30 |
30 |
27/12/04 |
359.23 |
198.43 |
5.32 |
51.70 |
28/12/04 |
448.29 |
355.37 |
5.57 |
58.12 |
29/12/04 |
465.58 |
260.40 |
5.11 |
52.03 |
30/12/04 |
303.48 |
147.94 |
3.76 |
52.35 |
31/12/04 |
475.98 |
248.58 |
4.66 |
55.11 |
1/1/05 |
336.11 |
258.21 |
5.05 |
53.85 |
2/1/05 |
NM |
NM |
NM |
NM |
*Tughlakabad has been considered as sensitive area as Batra hospital is in close vicinity.
NM: Not measured due to unavoidable reasons. |
 |
| |
Actual value |
| |
Permissible limit |
|
*Tughlakabad has been considered
as sensitive area as Batra hospital is in close vicinity.
DATE |
AQI |
DESCRIPTION |
COLOR |
27/12/04 |
279.71 |
Very
Unhealthy |
|
28/12/04 |
301+ |
Critical |
|
29/12/04 |
301+ |
Critical |
|
30/12/04 |
251.98 |
Very
Unhealthy |
|
31/12/04 |
301+ |
Critical |
|
1/1/05 |
268.21 |
Very
Unhealthy |
|
2/1/05 |
NM |
NM |
|
AQI
INDEX |
| INDEX VALUE |
DESCRIPTION |
COLOUR |
| 0-50 |
Good |
Green |
| 51-100 |
Marginal (Moderate) |
Yellow |
| 101-200 |
Unhealthy (Poor) |
Orange |
| 201-300 |
Very Unhealthy (Very Poor) |
Red |
| 301+ |
Critical |
Purple |
*What is
AQI? |

