|
|

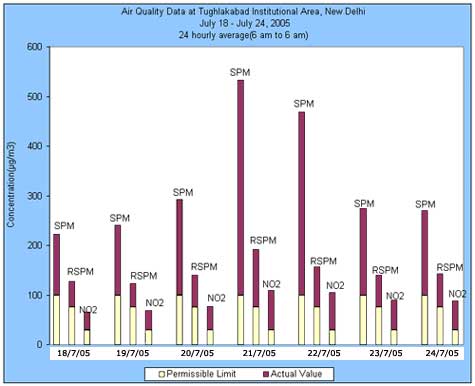
July 18 TO July 24, 2005
Parameters
Date |
Suspended
Particulate matter (mg/m3) |
Respirable
Suspended Particulate
Matter (mg/m3) |
Sulfur
dioxide
(mg/m3) |
Nitrogen
dioxide
(mg/m3) |
Maximum*
Permissible limit (mg/m3) |
100 |
75 |
30 |
30 |
18/7/05 |
122.11 |
52.92 |
2.90 |
35.78 |
19/7/05 |
140.47 |
47.66 |
2.67 |
37.90 |
20/7/05 |
192.11 |
64.60 |
4.28 |
47.54 |
21/7/05 |
432.28 |
116.16 |
9.96 |
78.93 |
22/7/05 |
369.19 |
81.08 |
8.01 |
74.59 |
23/7/05 |
174.12 |
64.59 |
4.93 |
59.46 |
24/7/05 |
169.38 |
67.74 |
4.21 |
57.55 |
*Tughlakabad has been considered as sensitive area as Batra hospital is in close vicinity.
NM: Not measured due to unavoidable reasons. |
 |
| |
Actual value |
| |
Permissible limit |
|
*Tughlakabad has been considered
as sensitive area as Batra hospital is in close vicinity.
DATE |
AQI |
DESCRIPTION |
COLOR |
| 18/7/05 |
122.11 |
Unhealthy |
|
| 19/7/05 |
140.47 |
Unhealthy |
|
| 20/7/05 |
192.11 |
Unhealthy |
|
| 21/7/05 |
301+ |
Critical |
|
| 22/7/05 |
284.67 |
Unhealthy |
|
| 23/7/05 |
174.12 |
Unhealthy |
|
| 24/7/05 |
169.38 |
Unhealthy |
|
AQI
INDEX |
| INDEX VALUE |
DESCRIPTION |
COLOUR |
| 0-50 |
Good |
Green |
| 51-100 |
Marginal (Moderate) |
Yellow |
| 101-200 |
Unhealthy (Poor) |
Orange |
| 201-300 |
Very Unhealthy (Very Poor) |
Red |
| 301+ |
Critical |
Purple |
*What is
AQI? |
