|
|

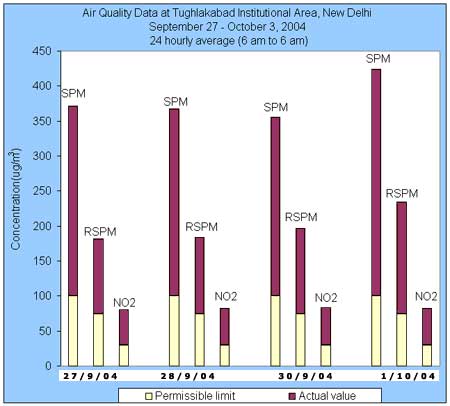
September 27 TO
October 03, 2004
Parameters
Date |
Suspended
Particulate matter
(mg/m3) |
Respirable
Suspended Particulate
Matter (mg/m3) |
Sulfur
dioxide
(mg/m3) |
Nitrogen
dioxide
(mg/m3) |
Maximum*
Permissible limit (mg/m3) |
100 |
75 |
30 |
30 |
27/9/04 |
271.18 |
106.54 |
5.77 |
50.50 |
28/9/04 |
267.40 |
108.86 |
6.21 |
52.57 |
29/9/04 |
NM |
NM |
NM |
NM |
30/9/04 |
255.94 |
121.70 |
6.26 |
53.26 |
1/10/04 |
324.58 |
159.48 |
5.81 |
52.18 |
2/10/04 |
NM |
NM |
NM |
NM |
3/10/04 |
NM |
NM |
NM |
NM |
*Tughlakabad has been considered as sensitive area as Batra hospital is in close vicinity.
NM: Not measured due to unavoidable reasons.
|
 |
| |
Actual value |
| |
Permissible limit |
|
*Tughlakabad has been considered
as sensitive area as Batra hospital is in close vicinity.
DATE |
AQI |
DESCRIPTION |
COLOR |
| 27/9/04 |
235.91 |
Very
Unhealthy |
|
| 28/9/04 |
234.03 |
Very
Unhealthy |
|
| 29/9/04 |
NM |
NM |
|
| 30/9/04 |
228.33 |
Very
Unhealthy |
|
| 1/10/04 |
262.47 |
Very
Unhealthy |
|
| 2/10/04 |
NM |
NM |
|
| 3/10/04 |
NM |
NM |
|
AQI
INDEX |
| INDEX VALUE |
DESCRIPTION |
COLOUR |
| 0-50 |
Good |
Green |
| 51-100 |
Marginal (Moderate) |
Yellow |
| 101-200 |
Unhealthy (Poor) |
Orange |
| 201-300 |
Very Unhealthy (Very Poor) |
Red |
| 301+ |
Critical |
Purple |
*What is
AQI? |

